| Music |
| Songs |
| Song Years |
| Song Artists |
| Song Titles |
| Song Charts |
| Albums |
| Album Years |
| Album Artists |
| Album Charts |
| Site Index |
Regional Hit Chart
JPP from Portugal suggested that it would be interesting to be able to compare and contrast the hit songs for each continent. This would let readers see how different regions have distinct musical "tastes".
Of course to be valid we have to have enough inputs in a selected region so that the results are not dominated by just a single chart's input and they "smooth out" any peculiar inputs. These restrictions mean that we can only really look at North America and Europe as the regions and only for the years 1950 to 2015. For this calculation Canada is part of North America and the UK and Ireland are part of Europe. There are a set of pages that compare the top 20 songs from North America, the whole World and Europe:
The North American results have been generated by combining all the charts from the USA and Canda. The European chart combines all the input charts that come from countries in Europe (which includes the UK). The scores generated use the standard approach to generating the score. Since North America represents 39.9% of the worlds music revenue and Europe has 37.1% this division is probably fair.
A different way to look at the regions is provided with the distinctive songs pages these list the hits that were most distinctive for the USA, UK, Germany, France, Canada, the Antipodes (Australia and New Zealand) and Scandanavia (Denmark, Norway, Sweden and Finland).
Regional Trends
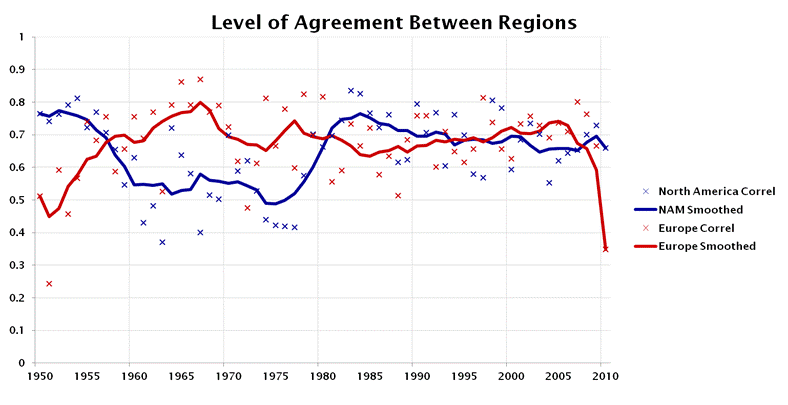
Starting with data version 2.0 the total scores are being adjusted to compensate for the large number of European charts available after 1980. This has radically improved the overall level of agreement between the regions.

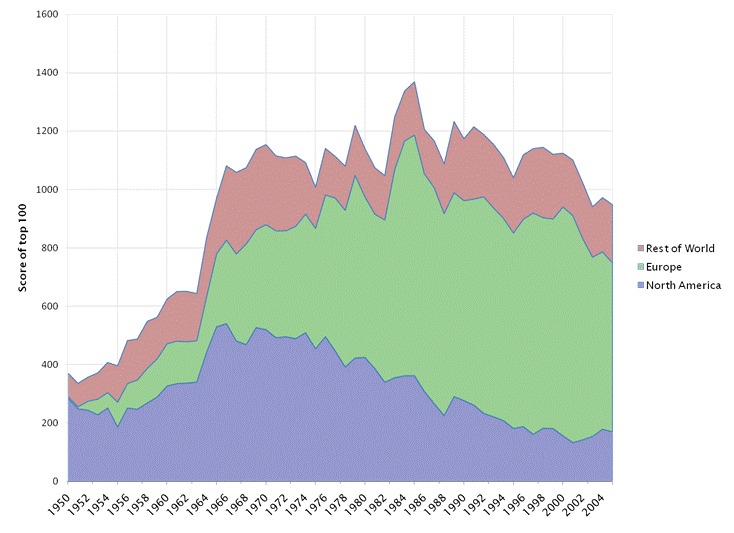
It used to be that the dominant factor when comparing data from the three defined regions was the number of chart entries for each year. There are few European charts that start before 1955, and the number of American entries declines from 1975 onwards. The plot above shows how the accumulated score for the top 100 songs used to change over the period. After 1990 the world chart correlated closely with the European entries and very poorly with the US ones.

Since the scores have been adjusted the correlation between the final result and the European charts after 1980 stays at about 0.7 (rather than 0.8), but the North American correlation value is now above 0.7 (rather than below 0.5). This picture shows that the results of comparison between the regions is now reasonable as a measure of success all the way to 2005. The regional comparison has only been done for the period 1950-2015.